Maersk Statistics & Facts (2024 Updated)
Maersk is a major player in the shipping industry as it operates 679 container ships totaling 4.16 million TEU. But just how big of a deal are Maersk in the global trade and logistics industry?
With that in mind, we’ll deep dive into some key Maersk statistics and insights about its operations, financials, and market impact.
Maersk Statistics: Key Findings
- Maersk operated 679 container ships with a combined capacity of around 4.16 million TEU, as per latest data.
- In 2023, Maersk’s annual revenue was US$51.1 billion.
- The average loaded freight rate is USD 2,313 per FFE.
- In 2022, Maersk operated 15.3% of the global container ship fleet.
- In 2019, Maersk employed 83,625 people.
- Maersk handles 1 in 5 containers shipped by sea.
- On average, a Maersk container ship calls on a port somewhere around the globe every six minutes.
Source: (Statista, Container News, CliffsNotes, CNBC, Maersk.)
Maersk Fleet Size
- Maersk operated 679 container ships.
- As of Q1 2024 reports, Maersk had 312 owned vessels and 367 chartered vessels.
Source: Maersk Interim Report 2024, Moody’s Financial Metrics
Maersk Revenue Statistics
Changes in global market conditions have greatly affected Maersk’s revenue and profitability in recent years. Here is an overview of the company’s financial results during this period:
| Years | Revenue (in billions) | Revenue Growth | Profit (in billions) |
|---|---|---|---|
| 2023 | 51.1 | -37.4% | 3.9 |
| 2022 | 81.5 | 32.0% | 29.3 |
| 2021 | 61.8 | 55.5% | 18.0 |
| 2020 | 39.7 | 2.2% | 29.0 |
| 2019 | 38.9 | -0.9% | -0.004 |
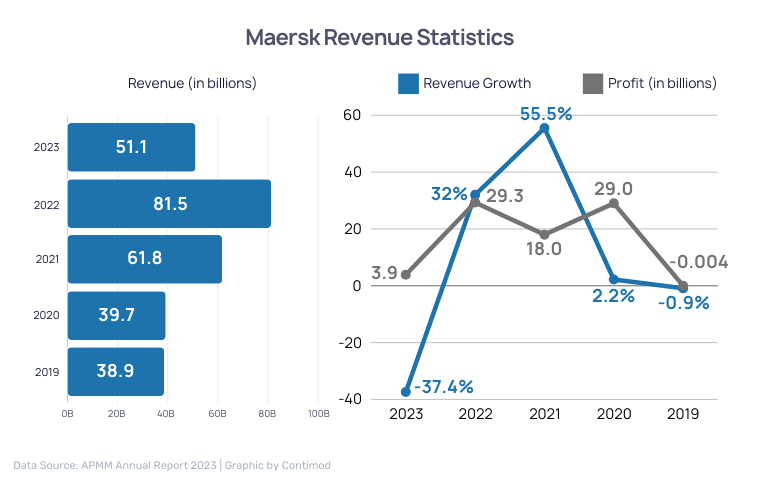
Source: APMM Annual Report 2023
Maersk Ocean Segment Statistics
Maersk’s Ocean segment reduced operating costs while keeping volumes steady in 2023. Here’s a quick look at the main stats and trends:
- The average operated capacity in 2023 was 4,162k TEU with 672 vessels.
- Maersk’s Ocean segment revenue in 2023 was USD 33.7 billion, down from USD 64.3 billion in 2022.
- In 2023, loaded volumes remained steady at 11.9 million FFE, the same as in 2022.
- The average loaded freight rate in 2023 was USD 2,313 per FFE.
- Operating costs in 2023 totaled USD 26.8 billion, compared to USD 30.6 billion in 2022.
- Maersk had 310 owned vessels with 2,363k TEU and 362 chartered vessels with 1,754k TEU by 2023.
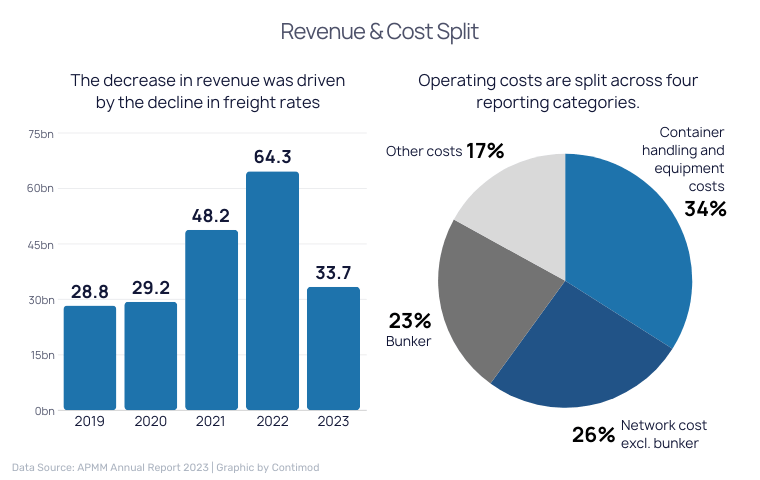
Source: APMM Annual Report 2023
Maersk Logistics & Services Segment Statistics
Maersk’s Logistics & Services segment experienced growth in revenue, profit, and operational volumes in 2023. The following data summarizes the key achievements:
- Maersk’s Logistics & Services segment generated revenue of $13.9 billion in 2023.
- The segment reported a gross profit of $4.2 billion for the year.
- The segment had $9.7 billion in direct costs in 2023.
- Maersk invested $10.8 billion in capital for its Logistics & Services segment in 2023.
- The segment’s air freight volume reached 295 thousand metric tons in 2023.
- Maersk Logistics & Services EBITDA was $1,251 million.
- The EBITDA margin stood at 9.0% for the segment in 2023.
- The segment had USD 446 million in EBIT and 3.2% margin.
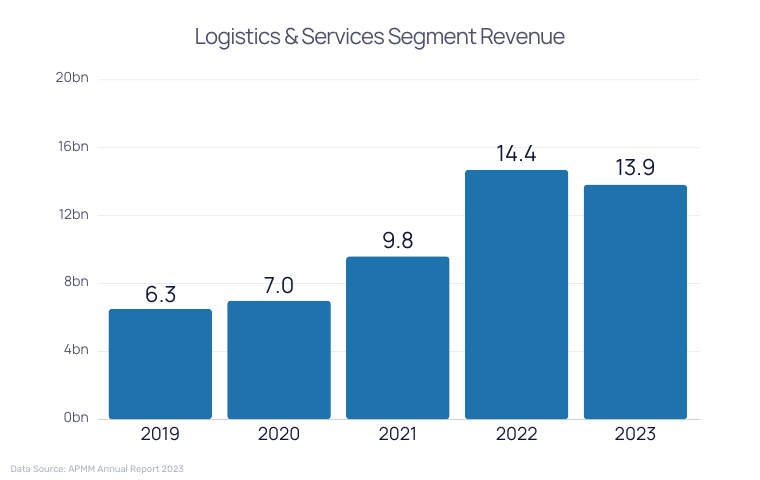
Source: APMM Annual Report 2023
Maersk Terminals Segment Statistics
Maersk’s Terminals segment showed strong performance in revenue, profitability, and investment in 2023. Key financial metrics are as follows:
- Maersk’s Terminals segment had a revenue of $3.8 billion in 2023.
- In 2023, the Terminals segment generated EBITDA of $1.3 billion.
- EBIT for the Terminals segment reached $980 million in 2023.
- The segment’s CAPEX for 2023 was $541 million, reflecting continued investment in terminal modernization.
- In 2023, the Terminals segment had a ROIC of 10.5%.
- In 2023, joint ventures and associated companies generated USD 282 million.
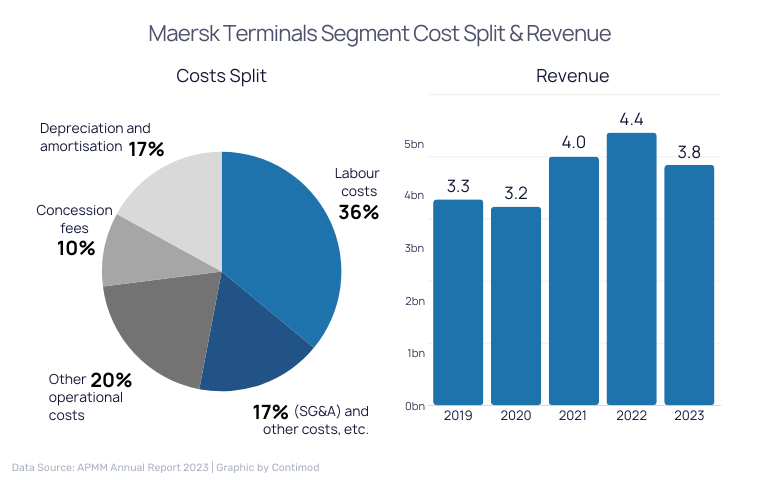
Source: APMM Annual Report 2023
Note: If you are planning to transport goods around the world and looking to buy shipping containers, then Contimod can help you buy conex containers by connecting you with container suppliers near your location.