37+ Free Shipping Statistics And Data: A Must Know in 2025
Free shipping has become a key factor in online shopping and influences where customers choose to buy. But just how essential is its role in the consumer’s decision process?
With that in mind, I’ll cover free shipping statistics that reveal how free shipping affects sales and customer choices.
Free Shipping Statistics: The Key Data
- 66% of consumers expect free shipping on all online purchases.
- 48% of online shoppers abandon their carts due to shipping costs.
- Free shipping can increase retailer sales by up to 10%.
- Free shipping has led to a 90% increase in e-commerce orders.
- Free shipping orders have a 30% higher average order value.
- Businesses that offer free shipping have a 20% higher conversion rate than those that do not.
- 84% have made a purchase specifically due to free shipping.
- 58% of customers have added additional items to their carts to qualify for free shipping.
- 90% of consumers say that free shipping is their primary reason for shopping online.
- 27% of consumers will avoid shipping costs by shopping in-store.
Sources: (PR Newswire, Hot Jar, Square Up, Shift 4 Shop, USPS Delivers, Up Sell It, E-Consultancy, Martech, Shopify.)
Does Offering Free Shipping Increase Sales?
Yes, free shipping unequivocally drives sales growth by reducing cart abandonment, increasing AOV, and fostering customer loyalty. A study by eMarketer revealed that 47% of shoppers abandon carts upon discovering shipping fees, while 88% of consumers are more likely to complete purchases from retailers offering free shipping, as reported by Gorgias. Also, ComScore and UPS found that 83% of consumers willingly delay delivery by two days to qualify for free shipping, indicating that eliminating costs is more important than delivery speed for most shoppers.
And as for retailers, profitability for providing free shipping depends on strategic execution, including data-driven threshold setting, cost absorption through margin analysis, and hybrid shipping models. Retailers must also align policies with evolving consumer expectations, as 75% of shoppers now demand free shipping on sub-$50 orders. To remain competitive, businesses should A/B test free shipping strategies, leverage psychological principles like loss aversion, and continuously monitor financial metrics to ensure sustainability. As eCommerce continues to evolve, free shipping will remain a critical lever for sales optimization.
Actions Taken by Consumers for Free Shipping
Consumers take various steps to qualify for free shipping such as delaying purchases or choosing specific shipping options. Here are the common actions they take:
- 58% add items to cart for free shipping.
- 50% choose the slowest transit time for free shipping.
- 47% search online for promo codes for free shipping.
- 35% choose ship-to-store for free shipping.
- 31% join loyalty programs for free shipping.
- 30% delay purchases for free shipping offers.
- 28% shop in physical stores instead of online for free shipping.
- 16% buy alternative products to meet free shipping threshold.
- 7% do not take action to qualify for free shipping.
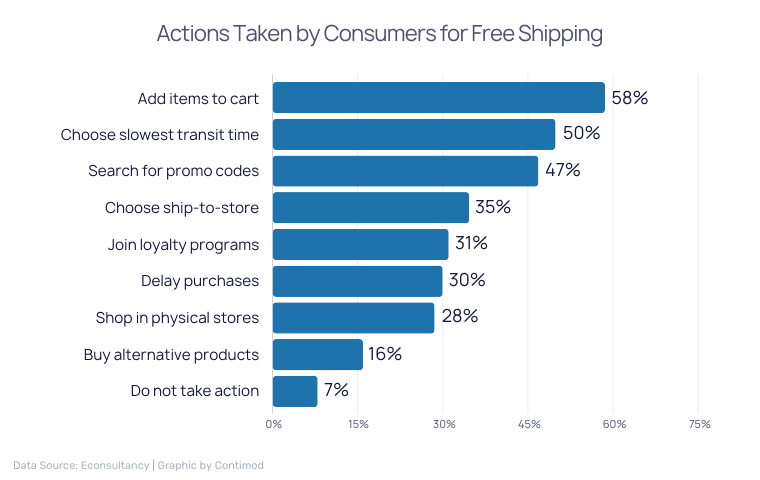
Source: Econsultancy
What Consumers Expect for Free Shipping Thresholds
Consumers have different expectations for free shipping based on their purchase amounts. Let’s see how these expectations vary across various order values:
- 8.8% expect free shipping under $5.
- 8.4% expect free shipping $5-$10.
- 15.8% expect free shipping $15-$20.
- 25.8% expect free shipping $20-$30.
- 26.8% expect free shipping $30-$50.
- 11.6% expect free shipping $50-$75.
- 2.8% expect free shipping over $75.

Source: Statista
Shipping Preferences of U.S. Online Buyers Statistics
U.S. online buyers place high importance on shipping features like free delivery, quick options, and hassle-free returns. Here’s what they value the most:
- 89% value free delivery.
- 65% prioritize easy return shipping.
- 36% want next-day delivery.
- 30% prefer same-day delivery.
- 20% choose shipping by a specific provider.
- 19% like self-selected delivery windows.
- 18% value green/sustainable shipping.
- 1% have no specific shipping preferences.
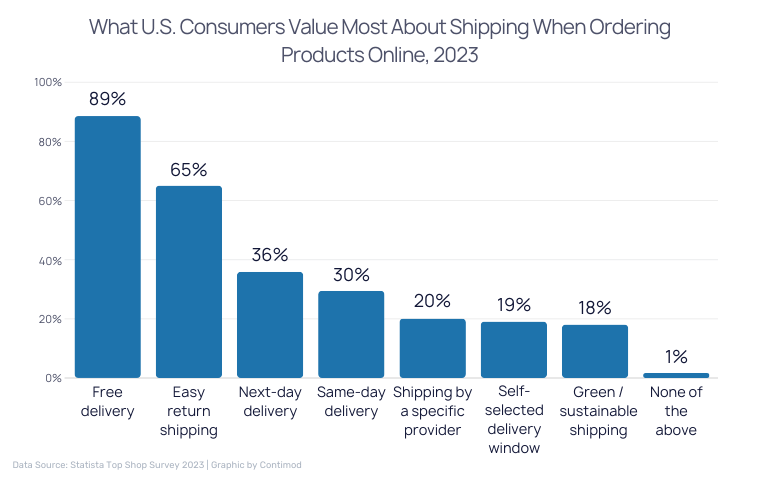
Source: Statista Top Shop Survey 2023
How Lack of Free Shipping Affects Purchases
Many shoppers hesitate to make purchases when free shipping isn’t offered by the online retailers. Here is how the absence of free shipping affects consumer behavior:
- 28% of shoppers are deterred by the lack of free shipping most of the time.
- 23% of shoppers avoid purchases due to no free shipping about half the time.
- 23% of shoppers occasionally avoid purchases without free shipping.
- 17% of shoppers are consistently deterred by the lack of free shipping.
- 9% of shoppers are never deterred by the lack of free shipping.
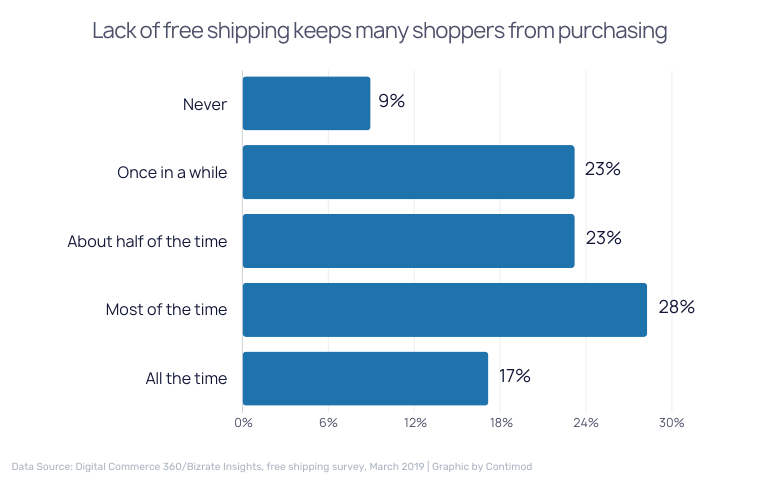
Source: Digital Commerce 360/Bizrate Insights, free shipping survey, March 2019.
Why Consumers Choose to Pay for Shipping
Even when free shipping isn’t available, consumers still opt to pay for shipping for several reasons. Here are the key factors that influence their decision to cover shipping fees:
- 41% pay for shipping if free shipping is not offered and they want the product.
- 32% pay for shipping if the total cost of the order is acceptable, even with the shipping charge.
- 26% pay for shipping if they do not have enough items in the cart to meet the threshold.
- 26% pay for shipping if they need the item faster than the free-shipping time offered.
- 25% will pay for shipping if the item is only available on one site with additional shipping fees.
- 19% will pay for shipping if the product discount exceeds the cost of shipping.
- 18% pay for shipping if they can not locate a promo code for free shipping.
- 18% pay for shipping if they want same-day delivery.
Source: Digital Commerce 360/Bizrate Insights survey of 1,097 online shoppers, August 2022.
Reason for Abandonment Duirng Checkout Related to Shipping
High extra costs and slow delivery often cause customers to abandon their carts during checkout. Here are the main reasons shoppers leave due to shipping-related issues:
- 53% of customers abandoned their carts due to extra costs being too high (shipping, tax, and fees).
- 16% abandoned their cart because the delivery was too slow.
- 20% couldn’t see or calculate the total order cost up-front, including shipping.
- 10% abandoned their cart due to an unsatisfactory return policy.
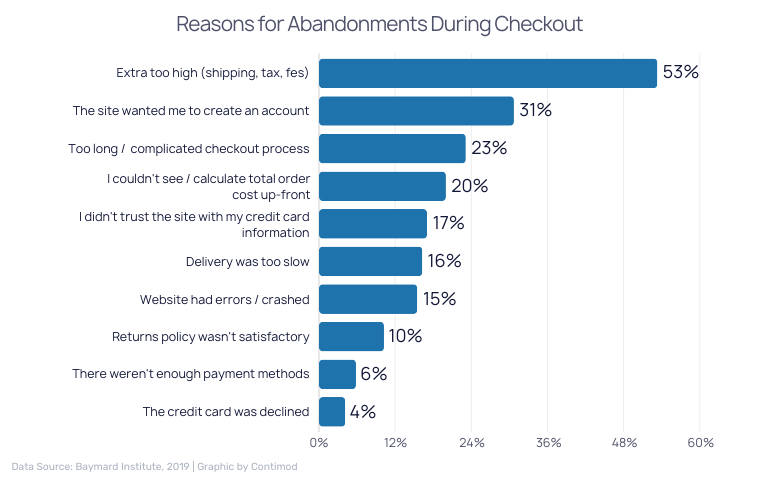
Source: Baymard Institute, 2019
To learn more about the shipping industry, we recommend you this resource page: https://www.contimod.com/logistics-statistics/