29 Construction Statistics: Industry, Trends (2025)
Construction shapes our cities and communities through the development of essential structures, roads, and infrastructure. But just how much do we know about the statistics behind the construction industry?
With that in mind, I’ll cover some of the key construction statistics that reveal insights into construction trends, employment, and future.
Construction Statistics: Key Numbers
- There were approximately 954,438 construction establishments as per the latest data.
- The US construction market was $2.3 trillion in 2023 and will grow over 3% from 2025-2028.
- The construction industry in the United States contributes 4.4% of GDP.
- 8.2 million are employed in the construction industry.
- Women make up 10.9% of the construction workforce.
- The average age of an employed construction worker is 38 years.
- 75% of construction companies expect hiring to become or remain difficult.
Sources: (GlobalData, Statista, Construction Employers Association, Impact)
Number of Construction Businesses By Year
According to data I gather from the U.S. Bureau of Labor Statistics (BLS), here’s a summary of the number of private-sector construction establishments in the United States for the years between 2020 and 2025.
| Year | Number of Establishments |
|---|---|
| 2020 | 903,000 |
| 2021 | 915,000 |
| 2022 | 927,000 |
| 2023 | 935,228 |
| 2024* | 954,438 |
| 2025* | 963,864 |
Note: These figures are approximate and represent the total number of private-sector construction establishments in the U.S. for each respective year. For year 2024, the data based on q3 of 2024. And as per 2025 number, it is predicted based on previous five years data.
If you want to learn in more depth about the construction industry, then we recommend you to read this resource page:
- Construction Site Theft Statistics show how theft is affecting construction sites across the country.
- Construction Cost Overrun Statistics show the frequency, causes, and average increases of construction costs across various projects.
- Construction Safety Statistics & Injury Numbers show the importance of safety measures in the construction industry.
We hope the above statistical information will help you to go into detail about the construction industry.
Also be noted if you are in the construction field and need construction storage containers rental or purchase in your area, then Contimod can help you buy or rent shipping containers by connecting you with shipping container suppliers near your location. So you can compare shipping containers for your construction storage or any other needs to get the best deals.
US Construction Spending Size
Construction spending in the US has experienced notable changes over the last decade as investments rise in both the private and public sectors. Here’s a look at the changes in spending from 2013 to 2023 as reported by the Statista:
| Year | Private construction (in billions) | Public construction (in billions) |
|---|---|---|
| 2013 | 643.9 | 270.7 |
| 2014 | 739.2 | 276.1 |
| 2015 | 838.3 | 293.8 |
| 2016 | 916.2 | 297 |
| 2017 | 983.3 | 296.5 |
| 2018 | 1,023 | 310.2 |
| 2019 | 1046.7 | 344.3 |
| 2020 | 1,130.4 | 369.2 |
| 2021 | 1,295.8 | 357.6 |
| 2022 | 1,519.2 | 383.5 |
| 2023 | 1,573 | 450.7 |
Source: Statista
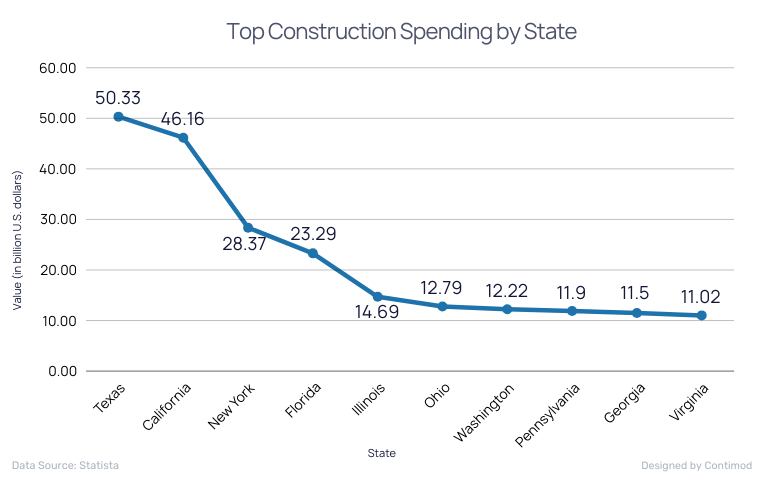
Construction Spending by State
The allocation of construction funds by state reveals wide disparities in investment levels across the country. Here’s how the numbers break down across the U.S.
| State | Value (in billion U.S. dollars) |
|---|---|
| Texas | 50.33 |
| California | 46.16 |
| New York | 28.37 |
| Florida | 23.29 |
| Illinois | 14.69 |
| Ohio | 12.79 |
| Washington | 12.22 |
| Pennsylvania | 11.9 |
| Georgia | 11.5 |
| Virginia | 11.02 |
| North Carolina | 10.57 |
| Michigan | 10.28 |
| Massachusetts | 9.45 |
| Utah | 9.14 |
| Indiana | 8.97 |
| Minnesota | 8.9 |
| Wisconsin | 8.79 |
| New Jersey | 7.92 |
| Colorado | 7.34 |
| Oregon | 7.21 |
| Maryland | 6.69 |
| Missouri | 6.35 |
| Tennessee | 6.33 |
| Louisiana | 5.76 |
| Iowa | 5.75 |
| Oklahoma | 5.45 |
| South Carolina | 5.16 |
| Arkansas | 4.92 |
| Alabama | 4.71 |
| Arizona | 4.7 |
| Kentucky | 4.58 |
| Nevada | 4.12 |
| Mississippi | 3.99 |
| Kansas | 3.92 |
| Connecticut | 3.37 |
| Nebraska | 3.21 |
| Hawaii | 2.89 |
| South Dakota | 2.82 |
| New Mexico | 2.51 |
| West Virginia | 2.29 |
| North Dakota | 2.21 |
| Idaho | 2.04 |
| Alaska | 1.91 |
| Montana | 1.84 |
| Maine | 1.63 |
| Delaware | 1.63 |
| Wyoming | 1.38 |
| District of Columbia | 1.35 |
| New Hampshire | 1.18 |
| Rhode Island | 0.98 |
| Vermont | 0.55 |
Source: Statista
Construction Business & Marketing Statistics
Marketing in the construction industry is evolving as most companies turn to SEO and social media to reach new audiences and grow their business. Here’s what the data tells us about the state of marketing in construction:
- There were over 919,000 construction establishments in the United States during the first quarter of 2023.
- Each month, 1.7 million people search for independent contractors online.
- 96% of people research local businesses like construction business online.
- 63% of construction companies recruit young workers via social media and digital advertising.
- 73% of construction companies say they plan to increase spending on SEO.
- 85% of marketers found that SEO is more successful than PPC.
- 69% of construction marketers said that unique content is the most valuable marketing tactic.
Source: (AGC, Constant Contact, Webfx, Construction Marketing Association, Zipdo)

Construction Worker Demographics Statistics
Construction workers come from diverse age groups and ethnicities with a smaller percentage of women and LGBT individuals in the field. Here’s a snapshot of who makes up the industry based on U.S. labor data.
Gender: 6.2% of all construction workers are female, 93.8% are male, and 2% are LGBT.
Ethnicity: The majority of construction workers are white (52.9%), followed by Hispanic or Latino (27.7%), Black or African American (11.1%), and Unknown (4.0%).
- White: 52.9%
- Hispanic or Latino: 27.7%
- Black or African American: 11.1%
- Unknown: 4.0%
Age:
- 67.9% of construction workers are aged 25-54.
- 22.7% are 55 or older.
- 9.4% are 16-24 years old.

Source: (Construction Employers Association, U.S. Bureau of Labor Statistics)
Construction Employment and Workforce Statistics
The construction workforce is expanding while still battling a shortage of skilled workers and open positions. Here’s a deeper look into the employment numbers and workforce challenges facing the sector today:
- There are over 767,992 construction workers currently employed in the United States.
- Construction job openings surge 41% year over year.
- As of January 31, 2024, the construction industry had 413,000 open jobs.2
- There are approximately 120,000 unfilled construction jobs, according to the latest figures.
- Construction employment grew from 5.0% of total employment in February 2020 to 5.2% in March 2024.
- The average hourly wage for all construction employees was $25.16.
| Year | Number of employee thousand |
|---|---|
| 2024* (June) | 8,245 |
| 2023 | 8,120 |
| 2022 | 7,884 |
| 2021 | 7,594 |
| 2020 | 7,354 |
| 2019 | 7,527 |
| 2018 | 7,396 |
| 2017 | 7,091 |
| 2016 | 6,818 |
| 2015 | 6,630 |
| 2014 | 6,293 |
Source: (Forbes, Statista, Constructiondive, Bureau of Labor Statistics, ZipRecruiter)

Challenges for the Construction Industry
The construction industry is facing some tough hurdles right now from economic worries to worker shortages. Here are the main challenges shaping the industry:
- 74% of contractors are concerned about an economic slowdown/recession.
- 73% are worried about rising material costs.
- 70% are concerned about the insufficient supply of workers or subcontractors.
- 67% are worried about rising interest rates and financing costs.
- 63% are concerned about rising direct labor costs (pay, benefits, employer taxes).
- 63% are worried about project delays due to availability or supply chain issues.
- 53% are concerned about worker quality.
- 37% are worried about other costs (e.g., trucking, insurance, design, or other services).
- 28% are concerned about project delays due to government review, permitting, or inspection delays.
- 27% are worried about increased competition for projects.
- 27% are concerned about inadequate construction education and training.
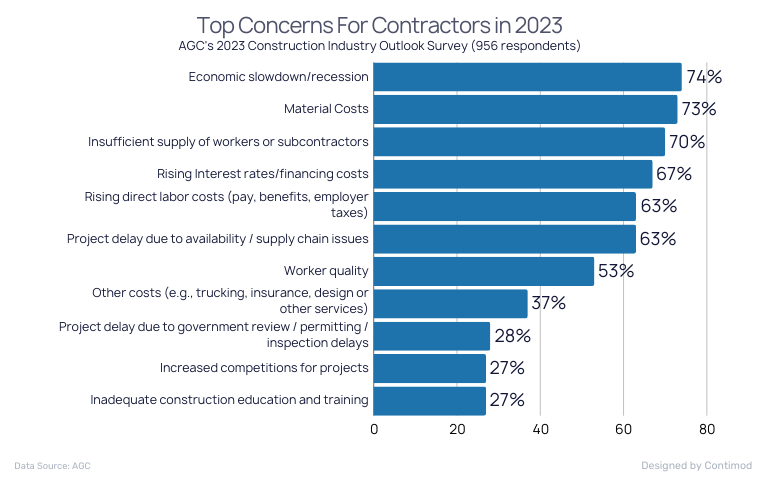
Source: AGC
Top 4 Causes of Construction Fatalities
Construction remains a hazardous industry with a high percentage of fatalities linked to falls and equipment accidents. According to OSHA, here are the leading causes of construction deaths:
- 36% of construction-related fatalities were due to falls.
- 10% of fatalities were caused by being struck by objects.
- 9% of fatalities were due to electrocutions.
- 2% of fatalities were caused by being caught in or between equipment or objects.

Source: OSHA