Amazon Statistics: The Ultimate Numbers Must Know in 2025
Amazon dominates the e-commerce market and changes how consumers worldwide purchase products online. But just how extensive is Amazon’s influence in the modern online marketplace?
With that in mind, I’ll cover Amazon statistics that reveal its substantial impact on global commerce.
Amazon Statistics: The Key Numbers
- Amazon has over 310 million users around the world.
- There are 9.7 million Amazon sellers worldwide, with 1.9 million actively selling on the platform.
- Amazon’s sales are expected to reach $746.22 billion in 2023.
- 92% of online shoppers have purchased an item from Amazon.
- 89% of online shoppers prefer Amazon to any other website for purchasing products.
- 64% of online shoppers have Amazon Prime.
- Americans spend an average of $91.75 on Amazon every month.
- Amazon makes an average of $1.29 billion in daily sales.
- Amazon currently lists over 353 million products.
- Amazon holds a 37.8% market share in retail e-commerce.
Sources: (Worldwide Business Research, Saras Analytics, Insider Intelligence, NPR, Forbes, CNBC, Helium 10, Retail Touch Points, Statista)
We have compiled additional Amazon resource statistics for your review. Here are additional resources on Amazon that are not included in this resource page.
- The Amazon Seller Statistics resource shows the true state of Amazon sellers.
- The statistics on Amazon logistics include the number of deliveries, revenue, and market share.
We hope these above statistics help you learn more about Amazon.
Note: If you are an Amazon seller and need storage containers for your product, then Contimod can help you connect with up to 5 storage container suppliers that serve your area.
Amazon Market Share
Amazon’s huge presence in the US e-commerce market is only getting bigger. Here are some key stats showing their current and future market share, sales numbers, and growth trends:
- Currently, Amazon accounts for 39.6% of the US ecommerce sales market.
- By 2025, Amazon’s share is projected to be 40.9% of the total US retail ecommerce market.
- Amazon will make up just 6.6% of US retail sales in 2024.
- Amazon’s retail ecommerce sales were $444.76 billion in 2023 and set to reach $540.29 billion by 2025.
- From 2023 to 2024, the increase is projected to be $46.89 billion (from $444.76 billion to $491.65 billion).

Amazon User Statistics
Amazon has a massive global user base, and it is heavily centered in the United States. Here are some key statistics that highlight this:
- Amazon has over 310 million active users worldwide, with 80% of those users coming from the United States.
- In the United States, there are approximately 161.7 million Amazon Prime users.
- Amazon Prime has over 200 million members worldwide.
- 98.07 million users access Amazon at least once a month.

Amazon Customer Satisfaction Rating
| Year | ACSI Score |
|---|---|
| 2018 | 82 |
| 2019 | 83 |
| 2020 | 79 |
| 2021 | 78 |
| 2022 | 78 |
| 2023 | 84 |
| 2024 | 83 |
Sources: American Customer Satisfaction Index (ACSI) annual retail reports and press releases
Amazon Prime Statistics
Amazon Prime is a key service in online shopping that offers numerous benefits like fast shipping and exclusive content to its subscribers. But, now lets look at some of Amazon Prime statistics.
- Amazon Prime has more than 200 million subscribers worldwide.
- About 65% of U.S. Amazon shoppers were Prime members.
- The number of Amazon Prime members in the United States is expected to exceed 180 million by 2024, up from 168.5 million in 2022.
- 81% of internet users aged 18 to 34 in the United States have a paid Amazon Prime membership.
- Amazon Prime’s retail subscription fees generate $25.21 billion in annual revenue.
- 82% of US households are members of Amazon Prime.
- With $12.7 billion in sales, Amazon Prime Day in 2023 set a new record.
- Amazon Prime members spend an average of $1,400 per year in the United States.
- 72% of U.S. residents receive same-day or next-day delivery from Amazon Prime.
- More than 175 million customers use Amazon Prime Video.
Source: (Amazon, Statista, Backlinko, Digital Commerce 360, Gizmodo, Statista, CNBC, Variety Magazine.)
Amazon Prime User Statistics
Amazon Prime is present in most US households. The Amazon membership numbers have increased greatly over recent years. Here is what the numbers show about this trend:
- As of 2024, Amazon has 180 million Prime members in the US.
- Amazon Prime memberships in the United States are up 8% from last year.
- Over the last five years (2019–2024), Amazon Prime users have grown 42.94%.
- Between 2017 and 2024, the number of Amazon Prime users increased by 80.4 million.
- 82% of US households are members of Amazon Prime.

Source: Statista
Amazon Search Statistics
How customers interact with Amazon’s search results reveals important shopping habits. Let’s examine key statistics that show Amazon’s impact and how search behavior shapes shopping:
- 63% of customers begin their product searches on Amazon.
- 90% of all product views on Amazon come from searches, not advertisements.
- 70% of Amazon customers never go beyond the first page of search results.
- 35% of Amazon shoppers click on the first product listed on a search page.
- 64% of clicks occur on the first three results displayed in a search.
- 81 percent of clicks go to brands on the first page of search results on Amazon.
- 98.07 million people use the Amazon app at least once a month.
- About 2.4% fewer people searched on Amazon US in July 2023 than they did in July 2022.
- 50% of Amazon searches are for gadgets.
- Amazon has a 45% share of the US online shopping market.
Sources: (Search Engine Land, Retail Dive, Search Engine Journal, Get Found Quick, AMZ Advisers, Linkedin, Seller App, Repricer Express)
Amazon Product Sales Statistics
Amazon product sales show some fascinating trends about how people shop on the platform. Check out these key stats to understand what drives customer behavior:
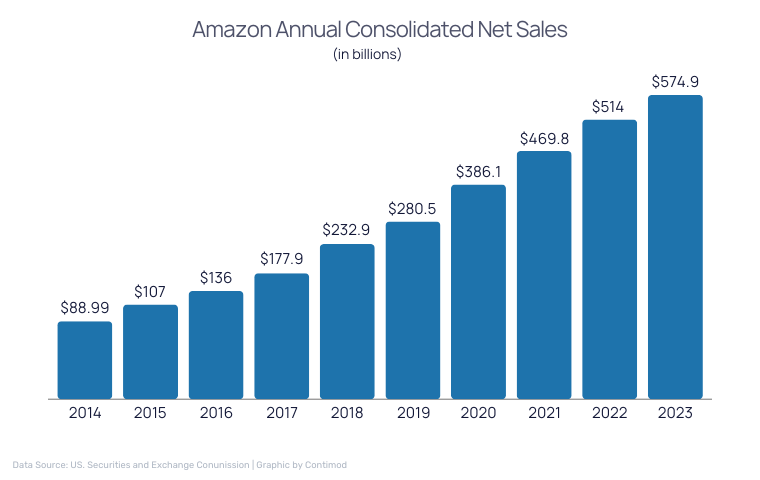
- Amazon’s net sales increased by 9% to $514 billion in 2022.
- Amazon currently sells over 12 million products.
- Amazon’s daily sales are $1.29 billion on average.
- Amazon’s sales are expected to reach $746.22 billion in 2023.
- 28% of Amazon purchases are completed in three minutes or less.
- 75% of shoppers use Amazon to find new products and brands.
- 52% of Amazon shoppers are more likely to purchase an unfamiliar brand.
- With 57.2 million sales, books are the most popular product category.
- Independent sellers in the United States sold more than 4,1 billion items in 2022.
- On average, Amazon sellers made over $230,000 in sales.
Source: (Amazon, Ecomcy, Helium 10, Insider Intelligence, ScrapeHero)
Amazon Advertising Statistics
Amazon Advertising helps sellers achieve high returns and strong conversion rates. Here are key insights that show its impact:
- Amazon sellers receive a 4.5x return on ad spend.
- For 2023, the current average CPC on Amazon is $0.97.
- 75% of Amazon sellers use at least one type of pay-per-click (PPC) advertising.
- An average Amazon PPC conversion rate of 9.89% speaks volumes about the power of Amazon ads.
- The average Amazon seller spends 22% of their revenue on advertising.
- Amazon’s advertising services business segment generated 7.3% of total net sales in 2022, up from 6.6% in 2021.
- Amazon’s advertising revenue reached $37.7 billion in 2022, a 20% increase from the previous year.
- Amazon currently holds 7.3% of the online advertising market.
- Approximately 42.2 billion U.S. dollars were spent on marketing by Amazon in fiscal year 2022.
- Amazon’s ad services revenue rises 22%, reaching more than $10 billion in Q2 2023.

Sources: (Brand Builder University, Ad Badger, Gotrellis, Jungle Scout, Statista, Search Engine Land)
Amazon Go Statistics
Amazon Go expands its physical stores and boosts sales yet many shoppers haven’t experienced it. Here are key insights about its growth and customer perceptions:
- Amazon’s physical store sales increased 12.5% in 2022.
- Net sales from Amazon’s physical retailing has reached nearly $19 billion globally in 2022.
- 59% of shoppers in the US think that Amazon Go will hurt other stores.
- 54% of customers who visited an Amazon Go said their visit was “excellent.”
- Only 28% of people visited an Amazon Go location.
- Approximately 20% of shoppers had never heard of the Amazon Go store.
- As of 2023, Amazon Go has 43 locations in Seattle, Chicago, London, and New York City.
- Amazon spent more than $1 million on hardware for the first Amazon Go location.
- 35% of Millennials and Generation Xers polled by Piplsay believe Amazon Go-style stores will be successful.
- Amazon Go customers spend between $7 and $15 per shopping trip on average.

Sources: (Winsight Grocery Business, Forrester Research, Grocery Dive, Supermarket News, Academic Accelerator, Vested Finance, Retail Dive)
Amazon Fresh Statistics
Amazon Fresh has become a major player in online grocery shopping and changes how consumers buy their groceries. Here are the key statistics that illustrate its influence and reach:
- Around 150 million people shop for groceries online.
- Amazon Fresh is used by approximately 48 million people for online grocery delivery.
- 32% of non-Prime shoppers bought groceries online from Amazon Fresh or Amazon.com, compared to 55% of Prime shoppers.
- Amazon Fresh’s revenue in 2022 was $4.96 billion, a 5.7% increase from 2021.
- 26% of online grocery delivery users in the United States say they will use Amazon Fresh again.
- Amazon Fresh has over 40 stores in the United States as of Q1 2023.
- 78% of the people who buy groceries online know about Amazon Fresh.
- Only 31% of Amazon Fresh shoppers were “affluent savers,” “value seekers,” “persevering parents,” and “frugal epicureans.”
- Amazon reported a 6% increase in physical store sales.
- Amazon Fresh is used by 15% of UK online grocery delivery users.
Sources: (Statista, Business Insider, Winsight Grocery Business, ECC Media, Q4.)
Amazon Customer Loyalty Statistics
Amazon has built a loyal customer base with frequent shoppers and high retention rates. Let’s see why customers return again and again:
- 89% of Amazon customers are loyal to Amazon.
- Amazon’s customer satisfaction score was 84 out of 100 ASCI points.
- Amazon Prime members have a 93% retention rate after one year and a 98% retention rate after two years.
- 85% of Prime shoppers visit Amazon at least once a week.
- 46% of Prime members purchase on Amazon at least once a week.
- The average Prime member spends approximately $1,400 per year, versus $600 for non-Prime members.
- 38% of Amazon customers in the United States made four or more repeat purchases.
- 98% of Amazon Prime members renew their subscriptions.
- 75% of shoppers use Amazon to find new products and brands.
- 52% of Amazon shoppers are more likely to purchase an unfamiliar brand.
Sources: (Comparably, Statista, Forbes, Martech, Fool, Advertising, Amazon.)
Amazon Alexa Statistics
Amazon Alexa has become an essential part of everyday life for millions and changes how we interact with technology. Let’s explore key statistics that showcase its widespread impact:
- 71.6 million people in the United States use Amazon Alexa.
- Alexa had a roughly 45% market share.
- Alexa is available on 60,000 devices and is linked to 100 million devices.
- Alexa has an estimated 66% market share in the United States.
- 100 million Alexa-powered devices have been sold.
- 25% of U.S. households had at least one Alexa device, according to Amazon.
- Amazon Echo was the most popular smart speaker in US households in 2020, with 46.5 million installed.
- It is estimated that 130 million Amazon Echos will be sold globally by 2025.
- Amazon Echo owners spend 10% more on Amazon than they did before getting the device.
- 74% of Alexa screen users use it weekly.
Sources: (Pop Sci, Globe Newswire, Venture Beat, Forbes, The Verge, Bloomberg, Statista, Science Direct, Insider, Tech Crunch.)
Amazon Audible Statistics
- Audible has more than 50 million paid subscribers.
- Audible has a 63.4% market share in the audiobook publishing category in the United States.
- The average amount of time spent listening to audiobooks per day is 41 minutes.
- Males account for 54.44% of Audible users, while females account for 45.56%.
- Audible’s annual revenue is estimated to be around $200 million.
- Audible’s revenue accounts for 4.2% of Amazon’s revenue from book publishing.
- 45% of Americans aged 18 and up have ever listened to an audiobook.
- 57% of regular audiobook listeners are under 45 years old.
- 32% of people read two or three books per month.
- Audible employs 32% women and 68% men.
Sources: (Wiredclip, Good e-Reader, Headphones Addict, eReader, Zippia, Words Rated, Lantern Audio, Great Work Life.)
How Many People Shop on Amazon
There are currently an estimated 300 million active Amazon users worldwide which is a 52.28% increase from the year 2020.
Amazon is one of the most popular online shopping destinations in the world, with an average of 2.5 billion monthly visitors, according to SimilarWeb. Millions of people use Amazon to buy everything from books to electronics to groceries. But just how many people shop on Amazon in 2022?
There are currently an estimated 300 million active Amazon users worldwide, which is a 52.28% increase from the year 2020, as reported by Amazon and Similarweb.
If you are interested in knowing more about other e-commerce competitors to Amazon, then we recommend you check out these online retailer resources pages.
We hope these resources will help you learn more about the current and futures of the retail and e-commerce industries.