32+ Supply Chain Statistics & Management: A Must Know in 2025
Supply chains are the foundation of global trade and are critical for businesses of all sizes. But how much do you really know about the statistics and figures that define this complicated network?
With that in mind, we will go over the key supply chain statistics that demonstrate the importance and challenges of today’s supply chain industry.
Supply Chain Statistics: Key Numbers
Here are some important supply chain statistics you need to be aware of right away.
- The global supply chain management market was $24.6 billion in 2024 and is expected to reach $30.91 billion by 2026.
- The global supply chain management market will grow by 98.45% from 2020 to 2026.
- AI in the supply chain will reduce 20–50% prediction errors, 65% sales losses, and 20–50% inventory overstocking.
- 79% of companies with high-performing supply chains achieve greater revenue growth than the industry average.
- 63% of companies do not use any technology to monitor their supply chain performance.
- 81% of supply chain professionals say analytics will be important in reducing costs.
- 55% of supply chain leaders are investing in technology and innovation, with 88% planning to spend over $1 million.
- By 2028, the market for AI in supply chains is expected to be worth $20 billion, growing at a CAGR of 20.5%.
- 62% of organizations have limited supply chain visibility, while 17% have extended visibility, 15% focus visibility only on production, and just 6% achieve full visibility.
Sources: (Statista, MTU, FITSmallBusiness)
Global Supply Chain Management Market Size Statistics
Recent years have seen steady growth in the global supply chain management market. Here are the details of this upward trend:
| Year | Market Size (Billion USD) |
|---|---|
| 2020 | $15.58 |
| 2021 | $17.47 |
| 2022 | $19.58 |
| 2023 | $21.95 |
| 2024 | $24.6 |
| 2025 | $27.58 |
| 2026 | $30.91 |
Source: Statista
Global Supply Chain Management Market Growth Rate
The global supply chain management market is growing consistently with some small changes each year. Here’s how the growth rates stack up:
| Year | Supply Chain Management Market Growth Rate (%) |
|---|---|
| 2021 | 12.13% |
| 2022 | 12.07% |
| 2023 | 12.10% |
| 2024 | 12.07% |
| 2025 | 12.11% |
| 2026 | 12.07% |
Source: (Contimod, Statista)
AI in Supply Chain Statistics
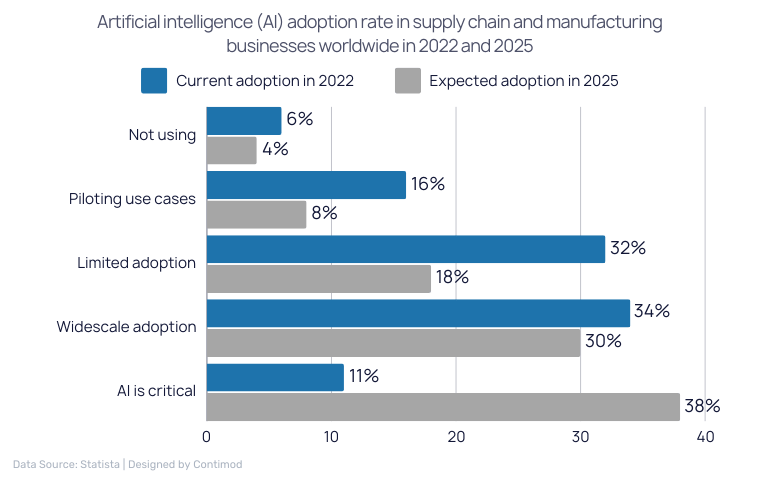
AI is really taking supply chain management to the next level by making it more efficient and reducing the number of mistakes that happen. Here’s what businesses can expect with AI:
- AI can boost supply chain management efficiency by 40% by processing data, forecasting trends, and automating tasks.
- AI in the supply chain will reduce future prediction errors by 20–50%, sales losses by 65%, and inventory overstocking by 20–50%.
- Early AI supply chain management adopters reported 15% lower logistics costs, 35% higher inventory levels, and 65% higher service levels.
- By 2028, the market for AI in supply chains is expected to reach $20 billion and grow at a CAGR of 20.5%.
- AI can lead to a 50% reduction in forecasting errors.
- 40% of high-performing companies use AI for demand forecasting, vs. 19% of low-performing ones.
Source: (McKinsey, BlueWeave Consulting and Research, Hypersonix AI, Gartner)

Retail Supply Chain Statistics
The retail supply chain adapts and grows in response to global events. Key aspects that influence the industry include:
- The retail supply chain management market is projected to grow from $31.11 billion in 2023 to $58.87 billion by 2030, with a CAGR of 9.54%.
- 64% of retailers adapted their supply chains for e-commerce due to the COVID-19 pandemic in 2020.
- 56% of retailers re-negotiated contracts as a result of the pandemic’s impact on supply chains.
- 28% of retailers explored alternative sourcing options during the pandemic.
- 28% of retailers faced shortages and out-of-stocks in their supply chains due to COVID-19.
Source: (Virtue Market Research, Statista)

Note: If you are a retail business and looking for freight containers for your storage and other uses, then Contimod can help you find shipping containers by connecting with up to 5 suppliers that serve your area.
Supply Chain Visibility Statistics
Most organizations continue to struggle to gain complete visibility into their supply chains. Here’s what statistics show about where businesses stand:

- 62% of organizations have limited visibility in their supply chains.
- 17% of organizations have extended visibility in their supply chains.
- 15% of organizations have visibility only in production.
- Only 6% of organizations have full visibility in their supply chains.
Source: (FinanceOnline)
Number of Supply Chain Disruptions Worldwide
Supply chain disruptions have surged globally in recent years with widespread effects on industries. Here is a look at the yearly statistics:

| Year | Number of Supply Chain Disruptions |
|---|---|
| 2019 | 3,700 |
| 2020 | 6,192 |
| 2021 | 11,642 |
Source: Statista
Supply Chain Challenges Statistics
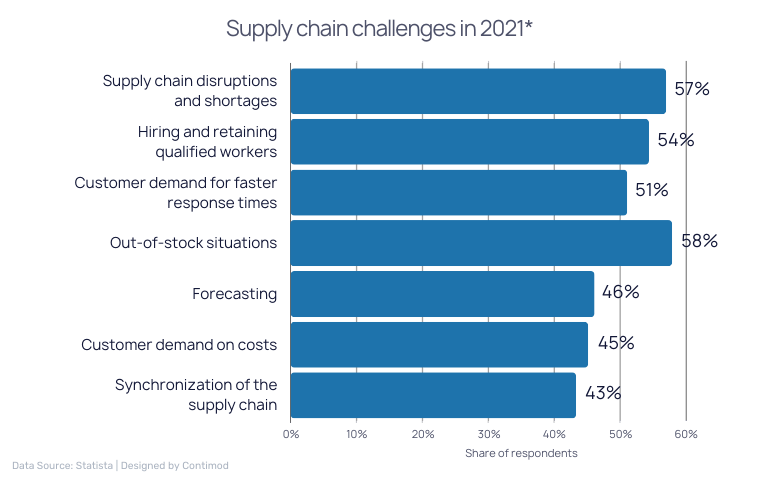
Supply chain problems impact companies on multiple fronts and disrupt their normal operations. Here are the main challenges they encounter in 2021:
- 64% faced supply chain disruptions and shortages in 2021.
- 61% struggled with hiring and retaining qualified workers.
- 56% were pressured by customer demand for faster response times.
- 51% encountered out-of-stock situations.
- 50% faced challenges with forecasting.
- 48% dealt with customer demands focused on cost control.
- 47% had difficulties synchronizing the supply chain.
Source: Statista

Action Taken as a Result of Supply Chain Challenges Statistics
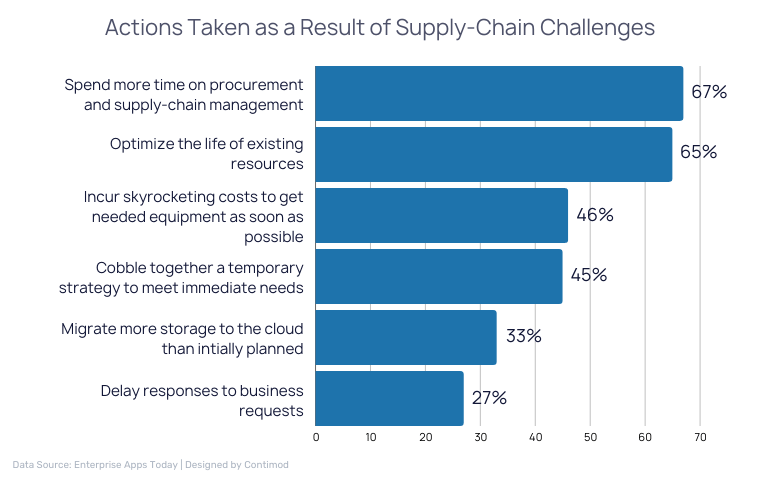
Supply chain problems have pushed companies to make some big changes to keep things running. Here’s how they’re handling the pressure:

- 67% spent more time on procurement and supply chain management.
- 65% optimized the life of existing resources.
- 46% incurred skyrocketing costs to get needed equipment as soon as possible.
- 45% cobbled together a temporary strategy to meet immediate needs.
- 33% migrated more storage to the cloud than initially planned.
- 27% delayed responses to business requests due to supply chain challenges.
Source: Enterprise Apps Today