Container Shipping Statistics: Key Numbers (2024)
Container shipping plays a huge role in global trade, moving billions of tons of goods every year. These stats show how big, efficient, and important the industry is.
With that in mind, we’ll cover key statistics that highlight the trends and significance of container shipping.
Container Shipping Statistics: Key Numbers
- Approximately 5,600 container ships operate worldwide.
- About 65 million shipping containers are in use worldwide.
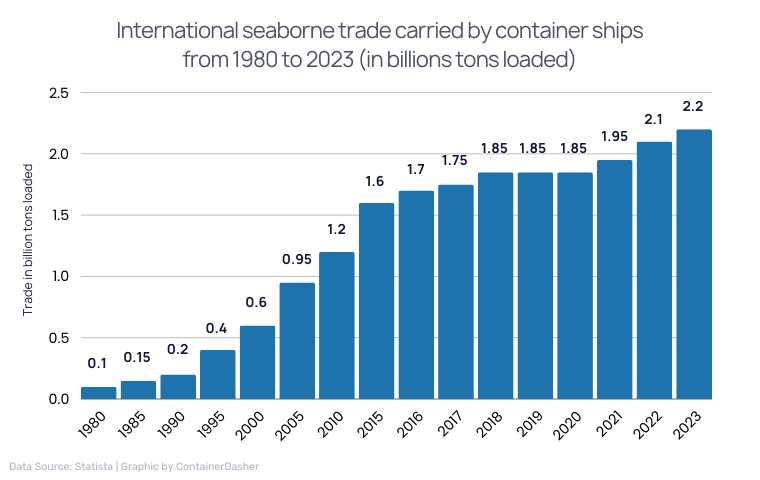
- About 2.2 billion metric tons of cargo were shipped globally in 2023.
- In 2022, the market size was $10.3 billion, and that number is projected to reach 15.87 billion dollars by 2028 globally.
- Containers transport approximately 52% of the world’s seaborne trade, while tankers transport 22%, general cargo 20%, and dry bulk 6%.
- Every year, an estimated 799 million shipping containers are shipped, according to average data from three years.
- Each year, an average of 1,622 containers fall off ships at sea.
- Between 1980 and 2020, the deadweight tonnage of container ships has grown from about 11 million metric tons to roughly 275 million metric tons.
- More than 60% of the world’s consumer goods are transported via shipping containers, worth nearly 14 trillion dollars.
Source: UNCTAD, Statista, Statista, PR Newswire, Reuters)
Container Shipping Volume Statistics
Container shipping is booming and just keeps growing. Check out these key stats to see what’s going on:
- 2.2 billion tons of containerized cargo were shipped worldwide in 2023.
- From 2018 to 2023, container ship international seaborne trade increased 18.92%.
- Between 2023 and 2026, global container trade is expected to grow 3.3% annually.
- Over 80% of goods are shipped by sea.
- Between 1980 and 2022, container ship deadweight tonnage increased from 11 million to 293 million.
Source: (Statista, Yahoo)
Ocean Shipping Statistics
Ocean shipping is the backbone of global trade, moving most of the world’s goods. Here’s a quick look at some key stats showing its huge impact and scale:
- Around 90% of world trade is carried out by sea shipping.
- The global market for cargo shipping was estimated at 10.8 billion metric tons in 2022 and is projected to reach 12.5 billion metric tons by 2030.
- The global cargo shipping market was valued at $2.2 trillion in 2021 and is projected to reach $4.2 trillion by 2031.
- Ocean shipping represents 2.9% of total greenhouse emissions.
- Maritime vessels account for 40% of U.S. international trade value.
- 76 percent of all trade involves some form of marine transportation.
- The top 10 ocean carriers control around 85% of the global container fleet.
- The largest container ship today has a capacity of 24,000 TEUs.
- The largest ocean carrier is MSC with a fleet capacity of 4.3 million TEUs
Source: (UNCTAD, Globe Newswire, PR Newswire, International Chamber of Shipping, OECD, Bureau of Transportation Statistics, NOAA.)
Shipping Emissions Statistics
Shipping emissions have a huge impact on global CO2 levels and our environment. Here’s a quick look at the key statistics around container shipping emissions:
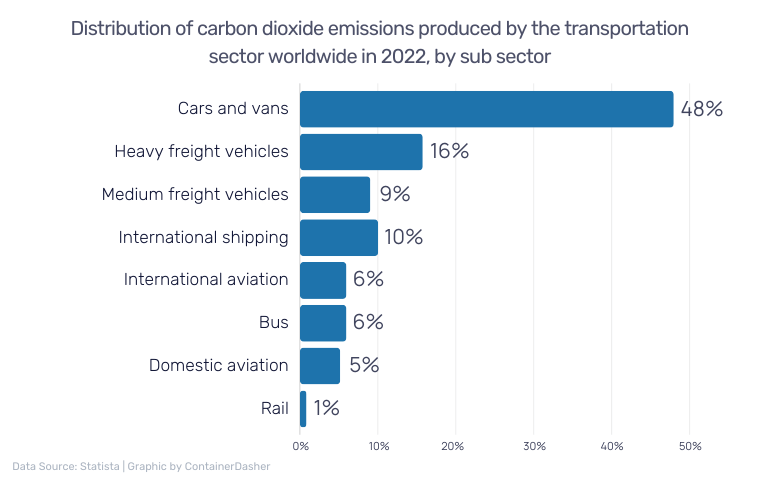
- Container shipping accounts for 11% of global transportation CO2 emissions.
- In 2021, international shipping emitted nearly 700 million metric tons of carbon dioxide (MtCO₂) into the atmosphere. This was an increase of roughly five percent from the previous year.
- In 2021, international shipping accounted for ~2% of global energy-related CO2 emissions.
- Some scientists have projected that maritime shipping could account for 17% of total annual CO2 emissions by 2050.
- In 2021 emissions from the international shipping sector grew by 5%
- Global shipping spews out 3% of worldwide greenhouse gases (GHG).
Source: (Statista, International Energy Agency, S&P Global, FreightWaves, The Guardian.)
Top Container Shipping Companies by Fleet Size
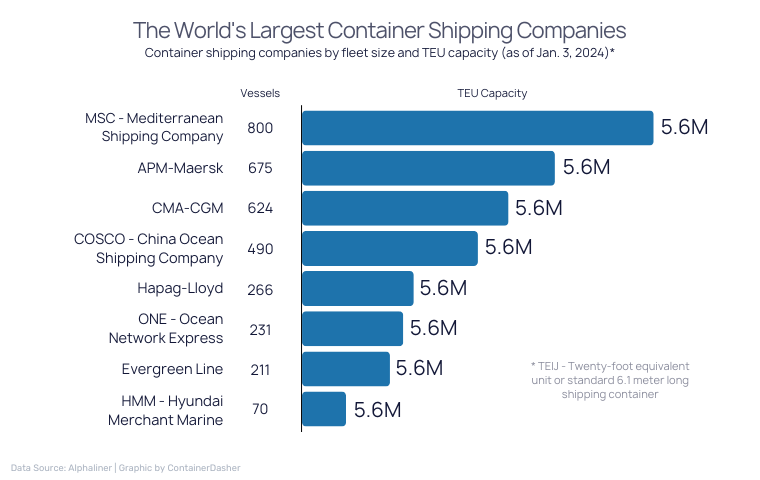
Let us look at the biggest names in container shipping and how many ships they each have. Here’s a list of the top companies based on fleet size:
- MSC – Mediterranean Shipping Company has a fleet of 800 vessels.
- APM-Maersk operates with 675 vessels.
- CMA-CGM has a fleet size of 624 vessels.
- COSCO – China Ocean Shipping Company operates 490 vessels.
- Hapag-Lloyd has 266 vessels in its fleet.
- ONE – Ocean Network Express operates with 231 vessels.
- Evergreen Line has a fleet of 211 vessels.
- HMM – Hyundai Merchant Marine operates 70 vessels.
Sources: (Alphaliner)
Top Container Ports by TEU Volume in 2005 and 2021
Container port activity has changed a lot from 2005 to 2021, showing big growth in key spots. Here’s a look at the top container ports by TEU volume during these years:
- Shanghai was the largest container port in 2021, with a volume of 47.0 million TEU.
- Singapore handled 37.5 million TEU in 2021, up from 23.2 million TEU in 2005.
- Ningbo-Zhoushan saw a significant increase to 31.1 million TEU in 2021.
- Shenzhen increased its volume from 16.2 million TEU in 2005 to 28.8 million TEU in 2021.
- Busan grew from 11.8 million TEU in 2005 to 22.7 million TEU in 2021.
Source: Marine Department (Hong Kong)
